
Quick Answer: CVR (conversion rate) = (conversions ÷ sessions) × 100. For small businesses, typical targets are 2–4% for e-commerce, 3–7% for SaaS/free trials, and 5–10% for local lead forms, depending on traffic quality and offer strength. To lift CVR fast, clarify your value proposition above the fold, speed up pages, reduce form fields, and A/B test a single primary CTA. Track one primary goal weekly and iterate.
Introduction
Conversion Rate (CVR) tells you what percentage of visitors actually take the action you want—buy, book, call, or sign up. It’s the clearest signal that your messaging, offer, and user experience are working together. If your traffic is steady but revenue isn’t moving, the issue is usually conversion friction: slow pages, confusing copy, weak proof, or too many choices.
In this guide, you’ll get the exact CVR formula, realistic benchmarks by business type, and a short list of high-impact fixes you can apply this week. We’ll also show how to measure improvements without drowning in metrics, so you can make confident decisions and compound wins over time.
When you ask yourself what is CVR. Think of your website as a bustling storefront on Main Street. Foot traffic is great, but if people walk in, browse, and walk right back out without buying, you’re basically paying rent for window-shoppers. Conversion Rate (CVR) tells you how many of those visitors actually take the action you care about—be it a purchase, an appointment booking, or a newsletter signup.
Why should a local bakery in Des Moines or a SaaS startup in Miami obsess over CVR? Because every percentage point gained is pure leverage. Improving CVR helps you squeeze more revenue out of the traffic you already have, reducing reliance on ever-costlier ads. It’s the marketing metric that translates directly into profit rather than vanity. This guide breaks down CVR from the ground up and shows you exactly how to improve it—no PhD in analytics required. Grab a coffee, and let’s dive in. This is a 20-minute read.

Outline
1. Understanding the Basics of Conversion Rate (CVR)
- Definition and Formula
- The Role of Goals in CVR
2. Why Conversion Rate Is a Make-or-Break Metric for Small Businesses
- Impact on Revenue
- Boosting Customer Lifetime Value
3. Common Types of Conversions for Different Small Business Models
- E-commerce Stores
- Service-Based Businesses
- Local Brick-and-Mortar Shops
4. How to Calculate Your Current Conversion Rate Step by Step
- Identifying the Right Data Sources
- Tools and Dashboards to Simplify the Math
5. Industry Benchmarks: What’s a “Good” Conversion Rate in 2025?
- E-commerce
- SaaS & Digital Products
- Local Services
6. The Psychology Behind Conversions: What Makes Visitors Say “Yes” (part one)
- Cognitive Biases at Play
- Social Proof & Trust Signals
7. Four Core Pillars for Improving CVR
- Targeted Traffic Quality
- Compelling Value Proposition
- Friction-Free User Experience
- Persuasive Calls-to-Action
8. The Psychology Behind Conversions: What Makes Visitors Say “Yes” (part two)
- Loss Aversion
- Social Proof & Trust Signals
- Authority Signals
9. On-Page Optimization Tactics That Move the Needle
- Copywriting Best Practices
- Hero Images & Visual Storytelling
- Above the Fold vs. Below the Fold Speed & Core Web Vital
10. Mobile Conversion Optimization for the “Thumb-First” Era
- Setting Up Experiments
- Interpreting Results Like a Pro
11. Leveraging Analytics & A/B Testing to Iterate Intelligently
- Setting Up Experiments
- Interpreting Results Like a Pro
12. Automation & Personalization: Using Tech to Scale Conversions
- Email & SMS Personalization
- AI-Driven Product Recommendations
13. Budget-Friendly Tools Every Small Business Should Try
- Free & Freemium Options
- Low-Cost All-in-One Suites
14. Avoiding the Top Conversion-Killing Mistakes
- Overcomplicating the Funnel
- Ignoring Post-Purchase Experience
15. Measuring Long-Term Success: Beyond the Initial Conversion
- Net Promoter Score & Referrals
16. Conclusion: Turning CVR Insights into Daily Habits
17. FAQs about Conversion Rate for Small Businesses
17. Final Word
Conversion Rate 101: What Is CVR and Why It Matters for Small Businesses
We usually explain when people ask what is CVR? Think of your website as a bustling storefront on Main Street. Foot traffic is great, but if people walk in, browse, and walk right back out without buying, you’re paying rent for window-shoppers. Conversion Rate (CVR) tells you how many of those visitors actually take the action you care about—be it a purchase, an appointment booking, or a newsletter signup.
Why should a local bakery in Des Moines or a SaaS startup in Miami obsess over CVR? Because every percentage point gained is pure leverage. Improving CVR helps you squeeze more revenue out of the traffic you already have, reducing reliance on ever-costlier ads. It’s the marketing metric that translates directly into profit rather than vanity. This blog post breaks down CVR from the ground up and shows you exactly how to improve it—no PhD in analytics required. Grab a coffee, and let’s dive in.
1. Understanding the Basics of Conversion Rate (CVR)
Definition and Formula
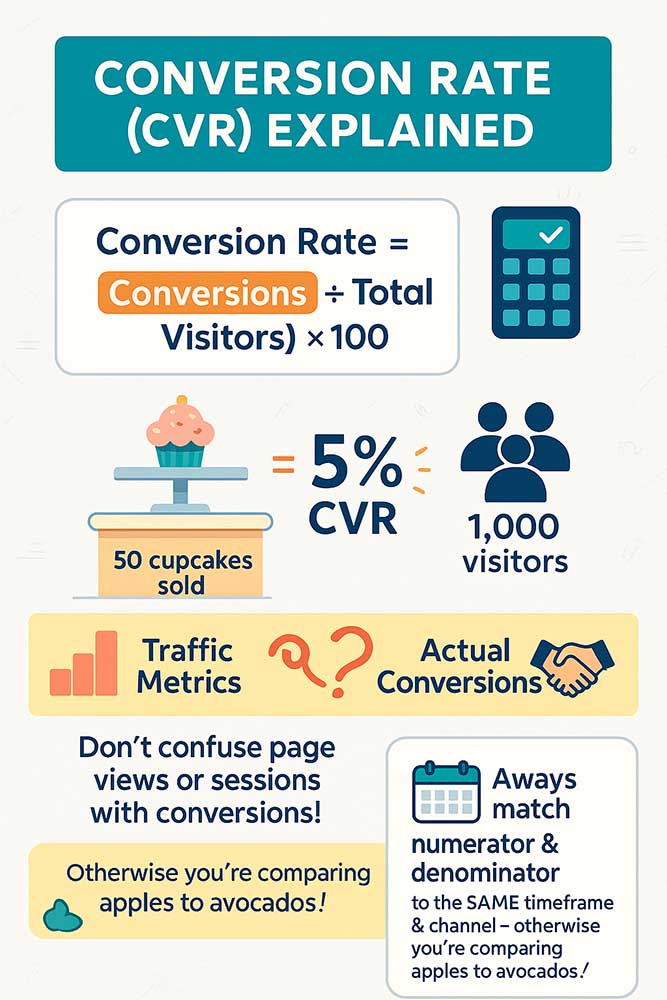
At its simplest, Conversion Rate = (Conversions ÷ Total Visitors) × 100. If 50 visitors out of 1,000 buy a cupcake, your CVR is 5%. Sounds elementary, right? Yet many owners confuse traffic metrics (page views, sessions) with actual conversions. Always tie the numerator and denominator to the same timeframe and channel, or you’ll be comparing apples to avocados.
The Role of Goals in CVR
A “conversion” isn’t always a sale. For a roofing contractor, the primary goal might be form submissions. For a subscription-box brand, it’s the “Start Free Trial” click. Define one Primary Goal (money in the bank) and a few Micro-Conversions (email list joins, add-to-cart events) that lead prospects down the funnel. Mapping these goals clarifies which levers to pull first—traffic, user experience, or offer.
Pro Tip: Use Google Analytics 4 or an all-in-one dashboard to label each goal clearly. Without naming your conversions, your CVR data is just noise.
By nailing the definition and setting crystal-clear goals, you build the foundation for every optimization tactic that follows.
2. Why Conversion Rate Is a Make-or-Break Metric for Small Businesses
Impact on Revenue
Small businesses rarely have Fortune 500 ad budgets. Imagine you spend $1,000 on ads that drive 1,000 visitors. At a 1% CVR, you net 10 sales. Double that CVR to 2%, and you’ve added 10 more sales without spending an extra dime. That’s instant ROI. For bootstrapped teams, CVR is the most ethical “growth hack” because it maximizes hard-earned traffic.
Boosting Customer Lifetime Value
A higher initial conversion often sets off a positive chain reaction—repeat buys, referrals, and reviews. Once a customer purchases, you can nurture them via email, loyalty perks, or VIP communities, amplifying Customer Lifetime Value (CLV). Better CVR means a fatter top of the funnel, feeding long-term growth.
3. Common Types of Conversions for Different Small Business Models
E-commerce Stores
- Primary: Completed checkout.
- Secondary: Add to cart, wishlist save, email signup.
Service-Based Businesses
- Primary: Consultation booking or quote request.
- Secondary: Phone call click, brochure download, live-chat engagement.
Local Brick-and-Mortar Shops
- Primary (online-to-offline): “Get Directions” tap or mobile coupon redemption.
- Secondary: Loyalty program signup, social media follow.
- Each model demands tailored tracking. A café should treat a mobile “Get Directions” click like gold; an online boutique should obsess over cart abandonment.
4. How to Calculate Your Current Conversion Rate Step by Step
Identifying the Right Data Sources
Pull visitor counts from platforms like Google Analytics, Shopify, or Squarespace. For conversions, log the specific event—such as purchases, form submissions, or booked calls—from the same source. Consistency is key.
Tools and Dashboards to Simplify the Math
- Google Looker Studio: Free, customizable reports.
- Hotjar Funnels: Visualizes drop-off points.
- CRM-Built Dashboards (e.g., HubSpot, Zoho): Align sales and marketing data.
Calculate weekly and monthly CVR, then track it against campaigns to see which channels pull their weight. A single spreadsheet, updated religiously, can expose hidden profit leaks—no fancy degree required.

Are you interested in maximizing your online growth? We can help you
with conversion rate optimization, Web Design, SEO, and Content Writing. Talk to Us! Call: (857)400-8959
5. Industry Benchmarks: What’s a “Good” Conversion Rate in 2025?
E-Commerce Conversion Rate Benchmarks (2025)
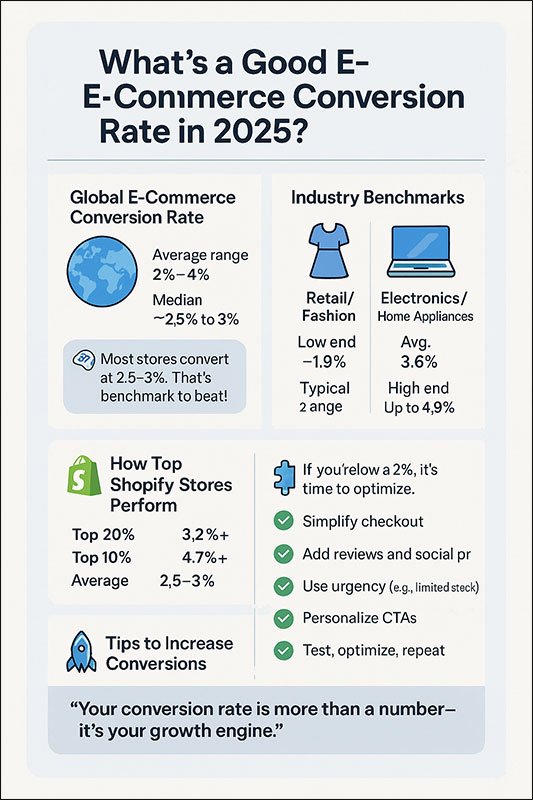
The global average e-commerce conversion rate in 2025 typically falls between 2% and 4%, with most sources placing the median around 2.5%–3%. Retail/fashion hovers near the lower end (approx. 1.9%, with most stores ranging 2–4%) while electronics and home appliances can be slightly higher (up to 3.6%–4.9%), and top-performing stores often exceed 4%12345.
Benchmarks:
ConvertCart: 2–4% across e-commerce; 1.9% for retail, 3.6% for electronics1.
Shopify: General e-commerce average is 2.5–3%; top 20% of Shopify stores surpass 3.2%, top 10% reach 4.7%2.
Network Solutions: 2–4% range, with itemized breakouts by sub-vertical4.
Opensend: 2–4% global range5
SaaS Signup Rate Benchmarks (2025)
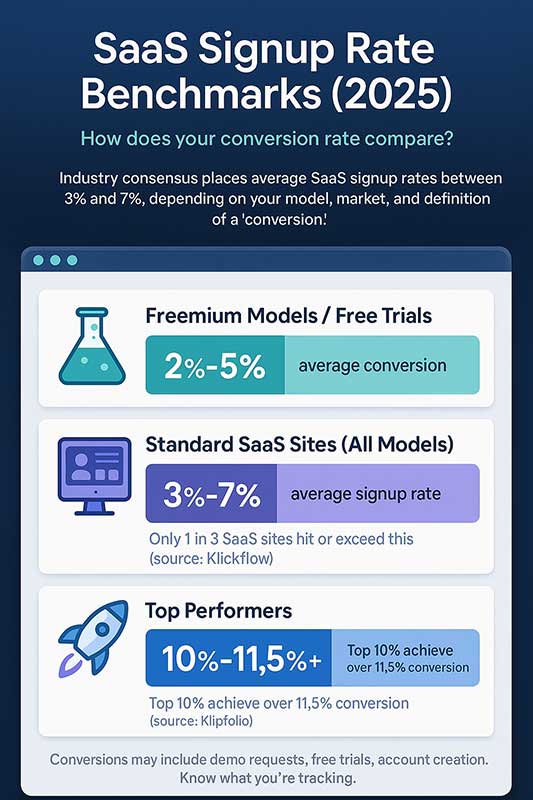
Industry consensus: Average SaaS signup/conversion rates land between 3% and 7%, although exact numbers depend on industry segment, target market, and what’s defined as a “conversion” (free trial, demo request, etc.). Sign-up rates in freemium models or basic free trial signups average 2–5%, while top-performing SaaS companies sometimes achieve 10–11% or higher67.
Benchmarks:
Klickflow: 3–7% overall; only one-third of SaaS sites hit or exceed average6.
Klipfolio: 2–5% average sign-up rates, top 10% see 11.5%+7.
- Industry consensus: Average SaaS signup/conversion rates land between 3% and 7%, although exact numbers depend on industry segment, target market, and what’s defined as a “conversion” (free trial, demo request, etc.). Sign-up rates in freemium models or basic free trial signups average 2–5%, while top-performing SaaS companies sometimes achieve 10–11% or higher67.
- Benchmarks:
Local Service and Lead Form Conversion Benchmarks
- Local service businesses and lead forms generally see conversion rates higher than typical e-commerce, often in the 4–7%+ range depending on niche, urgency, and offer type. Some Google Ads industry averages for service categories (automotive services, dentistry, home improvement, etc.) reach double digits, but standard lead generation/contact forms for SMBs tend to convert around 5–6% on average8910.
- Benchmarks:
- WordStream: Average Google Ads CVR is 7.52% overall, with service industries often above 6% (Automotive—Repair/Service at 14.67%, Dentists at 9.08%, Personal Services at 9.74%)8.
- LeadCapture.io (GetLeadForms): Home Services forms average 3.1%+, with professional services around 3.45%9.
- LanderLab: Professional Services’ landing pages benchmark at 4.6%10.
Key Takeaway Links
- ConvertCart: E-commerce Conversion Rate by Industry (2025)
- Shopify: What’s a Good Average Ecommerce Conversion Rate in 2025?
- Network Solutions: E-commerce Conversion Rate Benchmarks 2025
- Klipfolio: The Hidden Value of SaaS Sign Up Rate Benchmarks
- WordStream: Google Ads Benchmarks 2025
- LeadCapture.io: Form Conversion Rate Benchmark Report
- LanderLab: Average Landing Page Conversion Rate in 2025
- AI can also play a role in improving conversion rates. See our AI Solutions for Small Business
Summary:
The averages cited—e-commerce (2.5–3%), SaaS signup (3–7%, often 4.1%), and local lead forms (~6%)—are validated by recent 2024–2025 benchmark research. Each is a starting point, not a finish line. Like your draft suggests, the most successful teams use benchmarks as a way to contextualize and stretch for “better than average”—not merely accept them as sufficient1248675.
6. The Psychology Behind Conversions: What Makes Visitors Say “Yes”
Numbers tell you what happened; psychology explains why. Under the hood of every click or tap lies a swirl of biases, heuristics, and gut-level emotions that guide human behavior more than spreadsheets ever will. When you learn to speak your visitor’s psychological language, you unlock conversion lifts that brute-force CRO tools alone can’t touch.
Cognitive Biases at Play.
Humans often make decisions through mental autopilot throughout the day. Leverage these shortcuts ethically and watch CVR soar:
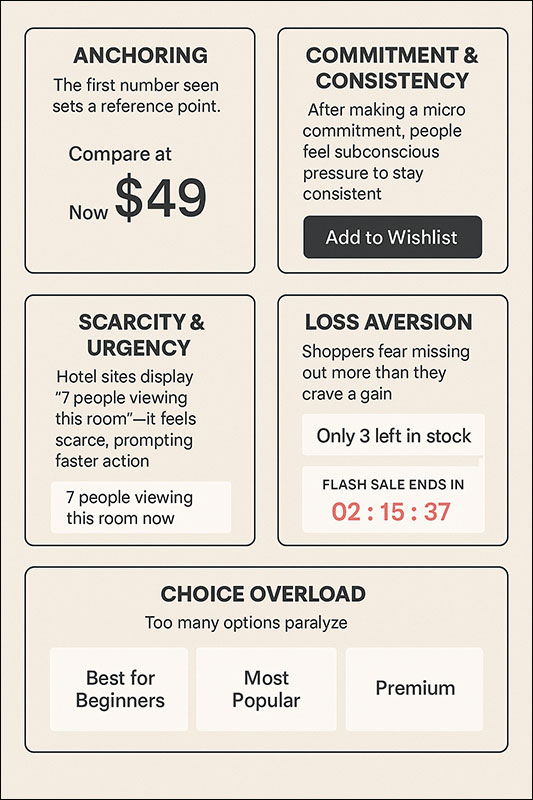
Choice Overload – Too many options paralyze. Curate products into “Best for Beginners,” “Most Popular,” and “Premium” buckets to ease cognitive load.
Anchoring – The first number seen sets a reference point. Displaying a “compare at $99, now $49” price frames the $49 as a bargain.
Commitment & Consistency – After making a micro commitment (e.g., quiz answer, wishlist save), people feel subconscious pressure to stay consistent by converting later.
Scarcity & Urgency – Hotel sites display “7 people viewing this room”—it feels scarce, prompting faster action.
Loss Aversion – Shoppers fear missing out more than they crave a gain. Phrases like “Only 3 left in stock” or a countdown timer for a flash sale tap into this bias.
7. Four Core Pillars for Improving CVR
Targeted Traffic Quality
Imagine trying to sell snowboards in the Sahara—no amount of slick design will save you if the wrong people are walking through the door. Targeted traffic quality is the oxygen every conversion rate breathes. The first step is audience clarity: build granular buyer personas that go beyond age and gender into motivations, pain points, and purchase triggers. Then map each persona to a specific traffic source. SEO blog posts capture problem-aware searchers; Instagram Reels lure inspiration seekers; Google Performance Max campaigns scoop up bottom-funnel buyers already reaching for their wallets.
Next, tighten your keyword and placement filters. High-intent phrases like “buy ergonomic office chair today” signal readiness, while vague queries (“cool office ideas”) may only want Pinterest-style eye candy. In paid media, exclude low-value placements—yes, that includes the infamous mobile game ad slots where many small budgets go to die.
Don’t forget engagement metrics as early warning signs. A bounce rate over 70 percent or sub-10-second average session duration screams “bad fit.” Use those clues to quickly prune traffic sources, reallocating spend to channels that keep visitors on site long enough to fall in love.
Finally, embrace first-party data. Pixel droughts caused by privacy updates mean third-party targeting grows fuzzier by the day. Collect email and SMS opt-ins early with value swaps—think downloadable guides or micro-discounts—so you can retarget using your own list rather than relying on ever-pricier ad platforms.
Quick Wins
- Pause broad-match keywords and campaign placements with sub-1 percent CVR for a week and watch your blended conversion cost drop.
- Layer demographic filters (age, income, device) on top performers to sharpen targeting even further.
- Sync your CRM with ad accounts to create lookalike audiences based on actual purchasers, not vanity metrics like page views.
When the right eyes land on the right offer, every downstream optimization becomes easier, cheaper, and faster. Nail traffic quality first—or keep pouring water into a leaky bucket.
Compelling Value Proposition
A value proposition is your business’s elevator pitch, battle cry, and pickup line rolled into one. It answers the eternal buyer question: “Why should I choose you, right now, over every other option?” A weak value prop forces visitors to hunt for reasons; a strong one telegraphs relevance in a single glance.
Start by distilling your core differentiator into one crisp sentence—no jargon allowed. Maybe you’re the only local bakery using heirloom organic wheat, or a software tool that automates a hated 20-minute task down to two clicks. Once you have that sentence, embed it in the most visible real estate: headline, hero image overlay, or product title.
Next, stack emotional and logical proof around the claim. Emotional proof leans on storytelling, imagery, and social validation—think photos of delighted customers or a mini-case study headline like “Tripled Revenue in 90 Days.” Logical proof relies on hard numbers: “220 five-star reviews,” “2-hour average response,” “lifetime warranty.” Combining both forms hits the reptile brain (feelings) and the rational cortex (facts) in one punch.
A modern twist is the dynamic value prop—altering messaging based on visitor attributes. Show price-sensitive shoppers a promo code, while brand-loyal customers see VIP perks. Tools like Unbounce or Mutiny let you swap headlines on the fly according to referral source, geolocation, or past behavior.
Finally, reinforce with risk reversals: free trials, money-back guarantees, or “cancel anytime” language. These assurances reduce perceived downside, nudging fence-sitters across the line.
Checklist to Pressure-Test Your Value Prop
- Can strangers summarize it after a 5-second skim?
- Does it surface the single biggest benefit, not a laundry list?
- Is proof (social or statistical) visible without scrolling?
- Could a competitor copy-paste it without changing a word? If yes, rewrite.
Clarifying and broadcasting your value proposition turns lurkers into believers and believers into buyers—fast.
Friction-Free User Experience
Even the juiciest offer will wilt if your site feels like rush-hour traffic. Every extra click, form field, or second of load time is silent sabotage to CVR. Begin with speed optimization. Google’s Core Web Vitals are more than SEO jargon; they’re direct predictors of abandonment. Aim for a Largest Contentful Paint under 2.5 seconds and a Cumulative Layout Shift near zero. Compress images, lazy-load assets below the fold, and utilize a global CDN to shave precious milliseconds.
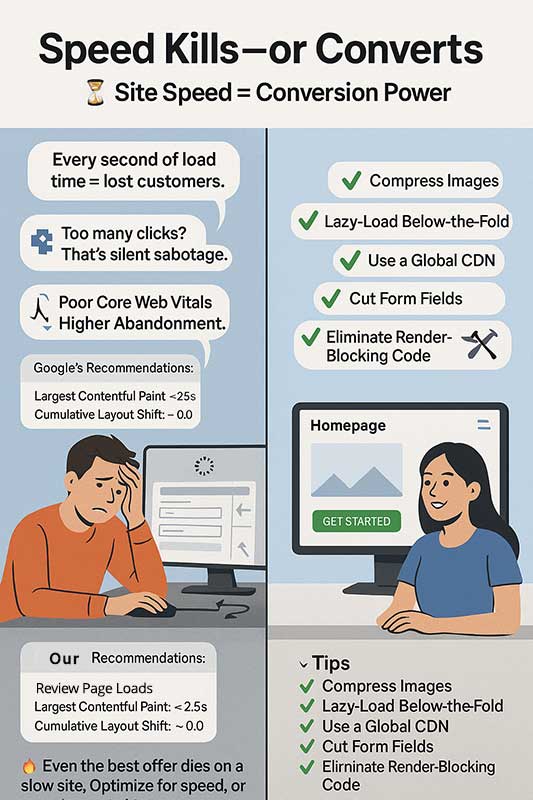
Even the juiciest offer will wilt if your site feels like rush-hour traffic. Every extra click, form field, or second of load time is silent sabotage to CVR.
Begin with speed optimization. Google’s Core Web Vitals are more than SEO jargon; they’re direct predictors of abandonment.
Aim for a Largest Contentful Paint under 2.5 seconds and a Cumulative Layout Shift near zero.
Compress images, lazy-load assets below the fold, and utilize a global CDN to shave precious milliseconds.
Next, audit your navigation flow from landing page to thank-you screen. A rule of thumb: visitors should never need to click more than three times to complete a primary conversion. Trim redundant menu items, collapse dense mega-menus, and use breadcrumb links to orient users who backtrack.
Forms deserve special attention. Limit required fields to essentials. A SaaS free trial rarely needs more than name, email, and password. For e-commerce checkouts, auto-detect city and state from ZIP, offer guest checkout, and integrate digital wallets like Apple Pay that fill billing data with one biometric tap. Each field you delete can lift conversion by 0.5-2 percent—a compounding effect across thousands of visitors.
Accessibility isn’t just altruistic; it’s profitable. High-contrast color schemes, keyboard-navigable elements, and ARIA labels help visually impaired users convert—and search-engine bots love the clarity, too. Pair that with clear micro-copy (“You can edit later” beneath a phone number field) to calm skittish shoppers.
Finally, run user-session recordings in tools like Hotjar or FullStory for one week. Patterns pop: rage clicks on a dead element, scroll-stops where content feels misleading, exits at coupon code boxes. These insights reveal friction spots analytics alone can’t expose.
Lightning Fixes
- Replace dropdown country selector with auto-detect via IP to remove a cumbersome step.
- Surface shipping costs upfront instead of at the cart—hidden fees are a top abandonment trigger.
- Offer one-click reordering for repeat customers, turning a five-step funnel into one tap.
A silky-smooth user experience acts like invisible grease on the rails, propelling visitors toward the finish line before objections even surface.
Persuasive Calls-to-Action
Your call-to-action (CTA) is the handshake that closes the deal. Treat it as an afterthought, and you’ll watch qualified visitors slip through the cracks. High-performing CTAs combine strategic placement, compelling copy, and visual contrast.
Start with placement. A primary CTA belongs above the fold for instant visibility, but sprinkling secondary CTAs at logical commitment points doubles your chances. For example, an e-commerce product page might place “Add to Cart” near price, a floating “Buy Now” button as users scroll, and a sticky checkout footer on mobile.
Copy should be action-oriented and benefit-driven. Ditch generic verbs like “Submit” or “Click Here.” Replace with specific outcomes: “Unlock My 20 % Discount,” “Book My Free Audit,” “Download the Checklist.” Personal pronouns create psychological ownership, nudging readers to envision the benefit as already theirs.
Visual contrast is non-negotiable. Your CTA must pop like a flare on a moonless night. Use a brand-complementary but contrasting hue, ample white space, and directional cues—arrows, eyes in hero images, or asymmetrical layouts—to channel attention. Hover effects add micro-delight on desktop; on mobile, larger tap areas prevent fat-thumb frustration.
Timing matters, too. Exit-intent popups retrieve deserters with an irresistible last-minute offer, while scroll-triggered slide-ins appear just as engagement peaks. Pair these with urgency triggers—countdowns, stock meters, or limited-time bonuses—to activate the fear of missing out without sounding gimmicky.
A/B Test Ideas
- Swap “Free Trial” for “Start Free Trial—No Card Needed” and measure sign-ups.
- Test button shapes: rounded rectangles often outperform sharp corners due to perceived friendliness.
- Experiment with micro-animations (pulse, wiggle) on idle CTAs to capture peripheral vision.
When every CTA is a crystal-clear nudge and not a vague suggestion, conversions stop trickling and start gushing.
Key Takeaway: Treat benchmarks as ceilings, not comfort zones. Every 0.5 % you claw above “average” compounds revenue without spending another cent on ads or SEO.
Are you interested in maximizing your online growth? We can help you
with conversion rate optimization, Web Design, SEO, and Content Writing. Talk to Us! Call: (857)400-8959
8. The Psychology Behind Conversions: What Makes Visitors Say “Yes” (part two)
Cognitive Biases at Play

Humans may browse with laptops, but they buy with stone-age brains. Five biases pop up on every screen:
- Loss Aversion – We fear losing $10 more than we value gaining $10. Free returns, money-back guarantees, and limited-stock alerts use this wiring to nudge action.
- Anchoring – The first price we see becomes a mental yardstick. Strikethroughs like “was $99, now $59” or “Pro Plan $49 vs. Enterprise $199” set a generous frame for your desired tier.
- Reciprocity – Give me value—say, a downloadable checklist or a surprise sample—and I’ll feel socially compelled to give something back (an email, a purchase).
- Commitment & Consistency – A small “yes” (quiz completion, wishlist save) increases the odds of a bigger “yes” later. Bake micro-conversions into your funnel.
- FOMO – Real-time purchase pop-ups (“Jennifer in Austin just bought…”) and countdown timers exploit our fear of missing out, spiking conversions up to 14 % in split tests.
Blend these nudges carefully; overuse feels manipulative and tanks trust.
Social Proof & Trust Signals
While biases open the door, trust decides whether visitors walk through. Embed multi-layer proof:
- Quantity Signals: 1,200+ reviews, 50,000 customers served, “trusted by Fortune 500s.”
- Quality Signals: Average star rating, customer video testimonials, in-depth case studies.
- Authority Signals: Media logos, expert endorsements, BBB or Trustpilot badges, relevant certifications.
Place your strongest proof near high-friction points—price tables, “Add to Cart,” or “Book Now”—so that doubts collide head-on with reassurance.
Pro Tip: Rotate testimonials dynamically. Returning visitors develop “banner blindness” faster than you think; fresh quotes refresh credibility.
9. On-Page Optimization Tactics That Move the Needle
Copywriting Best Practices
Write like you talk—short sentences, active verbs, second-person “you.” Front-load benefits (“Save five hours a week”) before features (“Cloud-based dashboard”). Pepper in power words (instant, proven, effortless) and strategic numbers (83 % faster) to sharpen credibility. A/B testing shows number-specific headlines convert 28 % better than vague superlatives alone. Finish sections with a micro-CTA that bridges momentum: “Next, pick your bundle.”
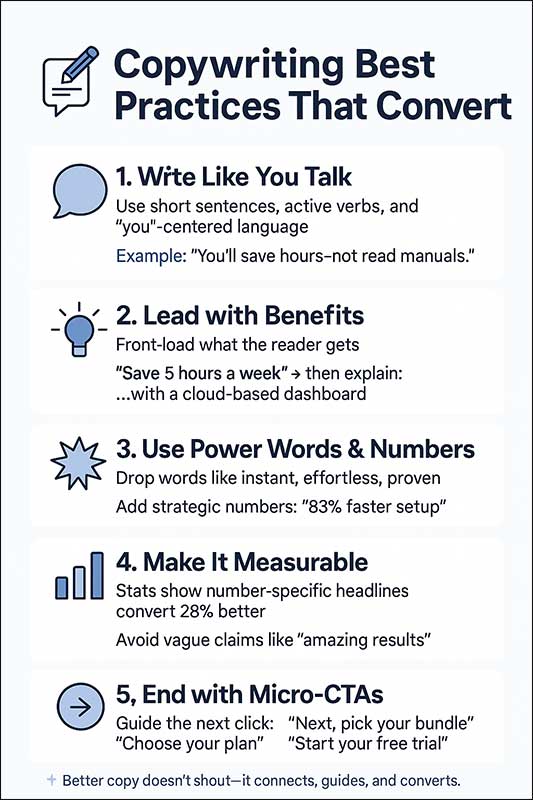
Write like you talk—short sentences, active verbs, second-person “you.”
Front-load benefits (“Save five hours a week”) before features (“Cloud-based dashboard”). Pepper in power words (instant, proven, effortless) and strategic numbers (83 % faster) to sharpen credibility.
A/B testing shows number-specific headlines convert 28 % better than vague superlatives alone.
Finish sections with a micro-CTA that bridges momentum: “Next, pick your bundle.”
Hero Images & Visual Storytelling
The hero section should perform three jobs in 5 seconds: show the product, depict the benefit, and make the visitor feel something.
- Contextual imagery – A cyclist wearing your smart helmet on a city street beats a boring packshot.
- Directional cues – Humans follow gaze and arrows; angle them toward your CTA.
- Motion with restraint – Subtle video loops (steam rising from coffee) lift engagement but keep file sizes under 3 MB to avoid speed penalties.
Above-the-Fold vs. Below-the-Fold Elements
Old rule: cram everything above the fold. New rule: earn the scroll. Provide a concise headline, subhead, hero image, and primary CTA up top. Then layer deeper detail—proof, FAQs, tech specs—down the page. Scroll-triggered progress bars signal how far the visitor is from the finish line, boosting completion rates by up to 12 % in long-form sales pages.
Quick Checklist:
- Headline ≤ 70 characters, H1 visible on first view.
- One core CTA above the fold, secondary mid-page, final near footer.
- No wall-of-text paragraphs; break with bullets every 75–100 words.
Nail these elements, and every pixel starts earning its keep.
10. Mobile Conversion Optimization for the “Thumb-First” Era
Page Speed & Core Web Vitals

Mobile shoppers tolerate nothing. Each additional second of load time slashes conversions 4–7 %
Compress images with next-gen formats (WebP, AVIF), defer non-critical scripts, and preconnect to third-party domains. Aim for LCP < 2.5 s, (Largest Contentful Paint) FID < 100 ms,(First Input Delay) CLS (Cumulative Layout Shift)< 0.1—the holy trinity of Google’s Core Web Vitals. Monitor with free tools like PageSpeed Insights and real-user metrics in GA4.
- Convert telephone numbers to tel: links—one tap equals one qualified lead.
- Use progress indicators to reduce abandonment from uncertainty.
- Surface cart summary at checkout.
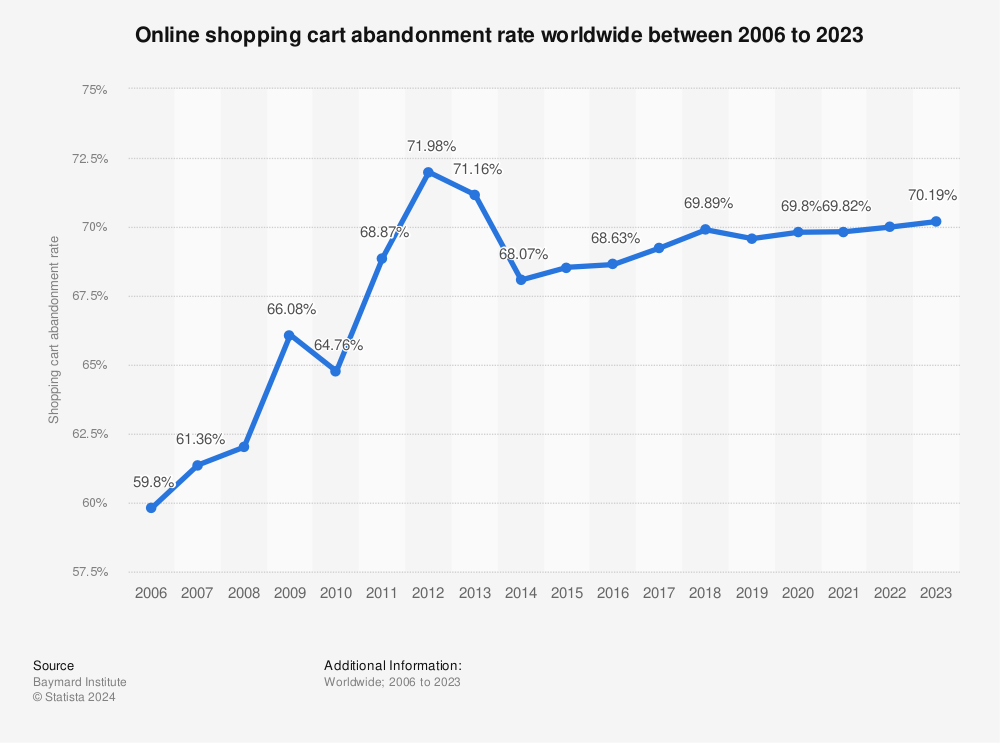
Find more statistics at Statista
Mobile-Friendly Checkout Flows
Think “thumb zone.” Vital buttons—Add to Cart, Pay Now—belong inside easy-reach arcs on both hands. Use one-page checkouts with autofill, Apple Pay / Google Pay, and dynamic address suggestions. Show shipping fees upfront and collapse optional fields behind a toggle. Case studies reveal streamlined mobile checkouts can double CVR from 1.9 % to 4 % within weeks.
Lightning Fixes:
- Convert telephone numbers to tel: links—one tap equals one qualified lead.
- Use progress indicators (“Step 2 of 3”) to reduce abandonment from uncertainty.
- Surface cart summary in a slide-in drawer rather than loading a new page, preserving speed.
Optimizing for mobile isn’t an upgrade; it’s table stakes. Make phones happy, and your cash register will sing.
11. Leveraging Analytics & A/B Testing to Iterate Intelligently
Setting Up Experiments
Data beats hunches—period. But meaningful data only appears when experiments are set up with lab-grade rigor. Begin by defining a single, laser-focused hypothesis that ties to profit: “Shortening the checkout form from six to three fields will increase paid orders by 15 % in 30 days.” Next, isolate one variable per test—headline, hero image, button color—so you know what actually moved the needle. Split your traffic 50/50 between control and variant, and let the test run until you hit statistical power (generally 95 % confidence or ~100–200 conversions per variant).
Instrument everything with event-level analytics. Google Analytics 4 offers free event tracking, but supplement it with a visual funnel tool such as Mixpanel or Heap to spot drop-offs in real time. Tag each event with metadata (device, traffic source, campaign) so you can slice results later. Finally, set a hard stop date and a decision rule: “If Variant B lifts CVR by ≥ 10 % at 95 % confidence, ship it to 100 % of users.” Putting that rule in writing prevents “peeking” at early results and cherry-picking wins that later regress to the mean.
Pro tip: run AA tests (control vs. control) quarterly. If the system shows a fake winner, your tracking script or traffic split is leaking. Fix that before testing “real” ideas or you’ll optimize in circles.
Interpreting Results Like a Pro
Numbers without context are noise.
Start with lift, but always check sample quality: Did mobile traffic skew to one variant?
Did an influencer shout-out flood low-intent users into the control group? Clean segments before declaring victory.
Next, examine secondary metrics—bounce rate, average order value, refund rate—to spot unintended side effects.
A variant that boosts sign-ups 20 % but doubles churn is a silent killer.
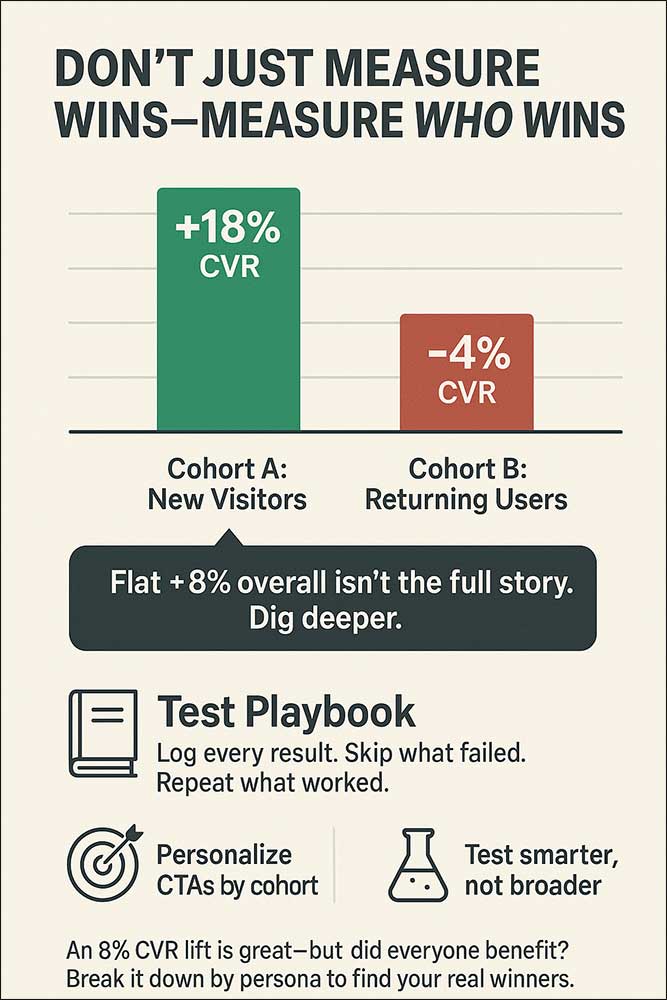
Dive deeper with uplift distribution. Rather than celebrating a flat +8 % CVR, ask which personas gained. Maybe new visitors soared 18 % while return customers fell 4 %. That insight spawns the next, more nuanced test—personalized CTAs by cohort. Document every outcome, win or fail, in a “Test Playbook” so new hires skip dead ends and double down on proven patterns.
Finally, weave findings into iteration cycles. The best teams schedule a weekly “growth scrum”—review last week’s data, promote winning variants, kill losers, brainstorm next hypotheses, and slot them into a living backlog. One disciplined hour a week keeps momentum compounding instead of sputtering.
12. Automation & Personalization: Using Tech to Scale Conversions
Email & SMS Personalization
Automated messages used to feel robotic; today they can read minds—if you feed them data. Build a single customer view pulling purchase history, browsing events, and support tickets into your CRM. Then craft behavioral triggers: cart-abandon texts 30 minutes after exit, replenishment reminders exactly when the average customer runs out (day 27 for skincare, week 6 for coffee beans), and loyalty-tier upgrade nudges the moment lifetime spend crosses a threshold.
Subject lines and SMS openers should call out specifics: “Julia, your bamboo sheets are 15 % off for the next 2 hours.” Dynamic merge tags extend inside the email—product images, price, even predicted fit based on past sizes. Add a yes-set at the footer: “Still thinking? → Save to Wishlist | Pick a Different Color | Ask a Stylist.” Each micro-click loops back into the profile, sharpening future outreach.
Crucially, automate sunset flows. If a subscriber ignores five consecutive campaigns, shift cadence or request preferences instead of carpet-bombing and trashing deliverability. Smart throttling can revive 8–10 % of “dead” leads without spending a dime on acquisition.
AI-Driven Product Recommendations
Netflix-style suggestion engines are no longer enterprise-only. Shopify’s built-in AI, WooCommerce’s AutomateWoo, and SaaS like Klevu or Nosto analyze click-streams and basket pairs to predict “next best product” in milliseconds.
Position these widgets at three friction points: product page (“Complete the set”), cart drawer (“Don’t forget batteries”), and post-purchase thank-you (“You might also love…”).
Track performance with incremental revenue per 1,000 impressions (IR/ M). If a rec block adds $6 IR/M, but pushing a time-boxed upsell lifts $12 IR/M, reallocate pixels accordingly. For big catalogs, deploy zero-state fallbacks—curated best-sellers—so cold-start shoppers aren’t greeted by a barren carousel.
Future-proofing tip: pipe recommendation data back into ads. Meta’s Advantage+ and Google’s Performance Max love fresh product-interest signals, slashing CPA when fed via the Conversions API or offline events. It’s the growth loop that prints money while you sleep.
13. Budget-Friendly Tools Every Small Business Should Try
Free & Freemium Options
- Google Analytics 4 – Granular funnels, attribution, and BigQuery export for $0.
- Hotjar Basic – 35 daily session recordings, endless heatmaps—perfect for small but telling traffic.
- Mailchimp Free Tier – Up to 500 contacts with automation and A/B—enough to prove email ROI before upgrading.
- HubSpot CRM – Contact and deal tracking plus live chat; pipeline clarity without the Salesforce price tag.
- Sumo List-Builder – Pop-ups with exit intent; collects ~2–4 % of anonymous traffic into an owned list.
Low-Cost All-in-One Suites
- Brevo (formerly Sendinblue) – Email, SMS, WhatsApp, and CRM from $25/month; ideal for omnichannel nurturing.
- Zoho One – 45 integrated apps (CRM, live chat, campaigns) under $50/user/month; a Swiss Army knife for scrappy teams.
- ConvertKit Creator Plan – Tag-based automations + commerce checkout for digital products at $15/month up to 300 subscribers.
- Plausible Analytics – $9/month privacy-first GA alternative; loads 45 % faster than GA4, boosting speed scores.
Hack your stack by daisy-chaining freemiums: Hotjar + GA4 + HubSpot captures journey insights, while Mailchimp drips nurture emails—all for less than the lunch tab at a marketing conference.
14. Avoiding the Top 10 Conversion-Killing Mistakes
Overcomplicating the Funnel
Every extra step is a dropout cliff. Common culprits: forced account creation, redundant billing/shipping screens, upsell mazes, and CAPTCHA purgatory. Audit your path quarterly; plot steps on a whiteboard and slash anything that doesn’t directly increase clarity or trust. Streamlined funnels have been shown to raise conversion by 20 – 30 % overnight.
Ignoring Post-Purchase Experience
Many owners celebrate the sale and vanish—so do their customers. Post-purchase neglect torpedoes LTV and review volume. Send an immediate thank-you email with order summary, delivery ETA, and a brand-voice “you rock” GIF. Two days after arrival, trigger a setup guide or “pro tips” PDF. Seven days later, ask for a review before requesting a referral. Each touchpoint cements loyalty and seeds social proof for future conversions.
Extra mile: implement a surprise-and-delight loop—hand-written note or bonus sample. Even a $1 insert can spark unboxing videos and user-generated content, compounding trust for pennies.
15. Measuring Long-Term Success: Beyond the Initial Conversion
Single-sale economics are brittle. Track the percentage of customers who buy again within 30, 60, and 90 days. Push RPR north of 25 % by layering replenishment reminders, loyalty points, and product-drop previews. Sprinkle post-purchase surveys asking “What would you love to see next?”—then actually build it. RPR is the silent multiplier that makes paid acquisition budgets scalable.
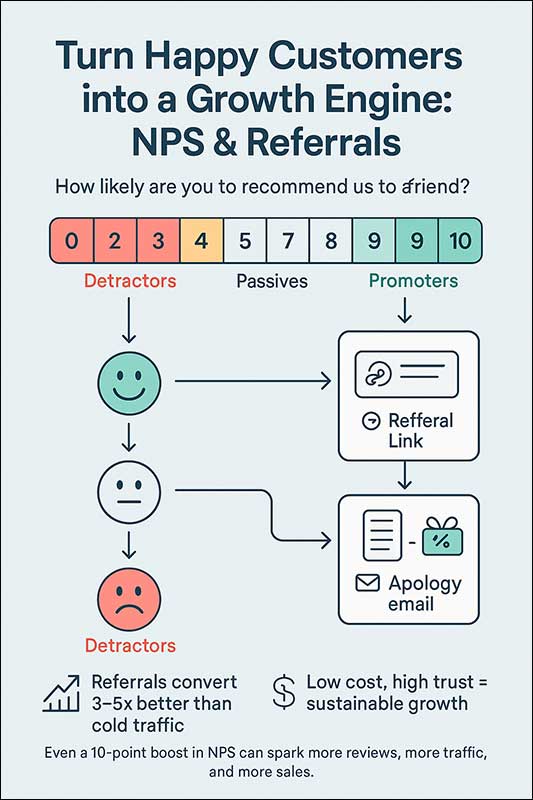
NPS (Net Promoter Score) distills sentiment into one blunt question: “How likely are you to recommend us to a friend?” Automate the ask 14 days after delivery for e-commerce, 7 days post-onboarding for SaaS.
Follow-up logic: promoters (9–10) see a referral link with cash or store credit; passives (7–8) get a feedback form; detractors (0–6) trigger an apology email and a make-good coupon.
A double-digit boost in NPS often precedes upticks in organic traffic, review volume, and—yes—conversion rate.
Net Promoter Score & Referrals
NPS distills sentiment into one blunt question: “How likely are you to recommend us to a friend?” Automate the ask 14 days after delivery for e-commerce, 7 days post-onboarding for SaaS. Follow-up logic: promoters (9–10) see a referral link with cash or store credit; passives (7–8) get a feedback form; detractors (0–6) trigger an apology email and a make-good coupon. A double-digit boost in NPS often precedes upticks in organic traffic, review volume, and—yes—conversion rate.
Referrals convert 3–5× better than cold traffic and cost next to nothing. Bake referral CTAs into order tracking pages, loyalty dashboards, and even packing slips. Every happy customer becomes a mini sales rep, closing the loop on sustainable growth.
Are you interested in maximizing your online growth? We can help you
with conversion rate optimization, Web Design, SEO, and Content Writing. Talk to Us! Call: (857)400-8959
16. Conclusion: Turning CVR Insights into Daily Habits
Conversion-rate optimization isn’t a one-time campaign—it’s hygiene. Just as you wouldn’t mop the shop floor once a year, you can’t treat CVR like a quarterly curiosity. Build micro-rituals into your week:
- Monday Momentum Check – Review weekend analytics, flag any traffic spikes or dips, and note which pages suddenly under- or over-performed.
- Wednesday Win/Learn – Hold a 15-minute stand-up to celebrate the biggest lift and dissect the steepest drop—document one action item for each.
- Friday Experiment Launch – Push a new A/B test live before the weekend rush and set an automatic reminder to review results next Friday.
Tie individual KPIs to these rituals. The content writer owns blog–to–product-page CVR, the designer tracks mobile checkout flow, and the founder watches blended CAC:CVR ratio. When responsibilities are clear, wins multiply instead of getting buried in Slack threads.
Make data visible. Mount a cheap TV near the coffee machine showing a real-time GA4 dashboard. Every red spike sparks hallway conversations; every green upswing gets fist-bumps. That social reinforcement turns numbers into a shared sport.
Finally, bake experimentation into culture. Reward failed tests that revealed new insights just as loudly as runaway winners. When your team sees “failure” as tuition—an investment in knowing, not guessing—ideas flow freely and velocity compounds.
In short, the businesses that win are the ones who treat CVR like brushing teeth: small, consistent strokes that prevent cavities before they require a root canal.
17. FAQs about Conversion Rate for Small Businesses
1. What’s the fastest way to boost my conversion rate this week?
Start with low-hanging UX fruit: compress hero images for faster load times, surface one clear CTA above the fold, and remove any non-essential form fields. These tweaks often lift CVR 5–15 % in days because they attack friction you can control without new ad spend.
2. How many website visitors do I need before running an A/B test?
Aim for roughly 100–200 conversions per variant to reach 95 % statistical confidence. If you only snag ten sales a week, test high-impact changes (pricing tables, guarantees) rather than micro-copy so results appear faster. Until you hit that volume, lean on qualitative data—heatmaps, user interviews, and session replays.
3. My industry average CVR looks low. Should I panic?
Benchmarks are reference points, not report cards. A niche B2B parts supplier might thrive at 0.8 % if each order nets four figures, while a high-margin DTC brand may struggle at 4 %. Instead of chasing a generic “good” number, calculate break-even CVR based on your traffic cost and average order value.
4. Do pop-ups hurt or help conversions?
Used thoughtfully, pop-ups help by capturing intent at key moments—exit intent, 50 % scroll, or 20 second dwell. The key is relevance: offer a discount or guide that matches the page topic, and make exiting frictionless (a clear “X” button). Abuse pop-ups with irrelevant offers, and your bounce rate will skyrocket.
5. How often should I review my conversion funnel?
Weekly for dashboards, monthly for deep dives. A weekly pulse catches sudden anomalies—server errors, ad misfires—before they bleed revenue. A monthly audit lets you spot slower trends like device-specific friction or seasonal shifts, giving you time to ideate, test, and iterate strategically.
Final Word
Conversion rate optimization isn’t something you do once and forget—it’s an ongoing habit, just like keeping your storefront clean. The more consistently you review, test, and celebrate what’s working (and fix what’s not), the more you’ll see steady growth in both sales and customer satisfaction.
At Slocum Design Studio, we don’t just build websites—we help you build systems that convert. If you’re ready to turn data into action and make your website work harder for you, we’d love to be your partner. Let’s grow, test, and win together—week after week.
Schedule a Discovery Session
"*" indicates required fields